How do we monitor real time user interactions using Flink and InfluxDB at VOLE ?

Vole is the first social network which dedicated to sport. It started operations in Turkey in April 2017 and became an instant hit among sports fans. So, now it has around one million registered user around the world. Hence, we needed a highly durable and scalable system to keep track of the interactions of users or the posts that were made. While keeping track of all these interactions, we also had to group these interactions over time and make various aggregations on them. Therefore, we needed the time series database and InfluxDB was our helper at this stage.
According to the documentation,
“InfluxDB is a time series database designed to handle high write and query loads. InfluxDB is meant to be used as a backing store for any use case involving large amounts of timestamped data, including DevOps monitoring, application metrics, IoT sensor data, and real-time analytics.”
InfluxDB Key Concepts
Before diving deeper into the whole architecture, it is useful to briefly mention the key concepts of InfluxDB.
Bucket
All InfluxDB data is stored in a bucket. A bucket combines the concept of a database and a retention period.
Measurement
Measurements can be thought of as tables in relational databases. A measurement acts as a container for tags, fields, and timestamps.
Tags
Tags are the automatically indexed column in measurements. Care should be taken when specifying tags, which is one of the most important factors affecting query performance. For example, setting a unique value (userId, objectId, etc.) as a tag will adversely affect query performance and cause high cardinality problem in InfluxDB. You can find out how we solved these problems later in the article.
Fields
Fields are also columns in measurements bu they are not automatically indexed.
Timestamp
Since it is a time series database, each record is saved with a timestamp value. On disk, timestamps are stored in epoch nanosecond format. Also, timestamp precision is important when you write data.
Overall Architecture

First of all, we produce our interaction events from our mobile services api to Kinesis data stream. For the consumer side, we create a flink cluster in our Kubernetes cluster with a different namespace. In our flink application, we use two different sinks. One is sinking data to AWS S3, the other one is sinking to InfluxDB.
Our requirements
The thing that requested from us, was the visualization of three different types of event interactions in real time. These three types of event interactions were as follows:
1- Interactions made by a user
2- Interactions received by a user
3- Interactions received by a share
Development
Flink side
All these above interactions had to be shown in various date ranges and with various window durations. At first, we gathered all these interaction types under a single InfluxDB bucket in a way to be differentiated with different fields, measurements and we use our user ids and share ids as tag. However, as a result of this approach, we encountered various problems such as low query performance and high cardinality. Also with this approach we have to write complex queries to aggregate data. The biggest reason for this poor performance was that we used a unique value like user id as a tag.
So, as a result of these bad experiences, we decided to change our data writing logic. First of all, we started by separating our interaction types. For this improvement, we created three different buckets for each interaction type. Then, we decided to reduce number tags which exist in the buckets. We used the first four digits of user ids as tags for interactions made and received. And for the interactions received by a share, we used our first six digit of our share ids. Our share id fields simply consist of the BSON Object Id. As you know, the first seven characters in BSON id are represent the timestamp and each unit increment in the sixth character of BSON id corresponds to approximately four minutes of change. So, we used the first sixth characters of our ids as tag.
Lastly, we added a streaming file sink to our data stream to write all our record to S3. Before we wrote our records we assigned a custom bucket assigner which splits our records to partitions as YYYY/MM/DD manner. With this way, we achieved partitioned data in S3.
Backend side
On the backend side, we used Akka HTTP and to write influx queries we used fluxDSL.
Here, the is an example query to get interactions received by a user.
With the range query, we determine the start and end time of the query. By updating the filter section, we can find out how much a user interacts with each interaction type. We divide the time interval we have, into 10-minute intervals with the aggregateWindow query and count the interactions that the users have.
Visualisation
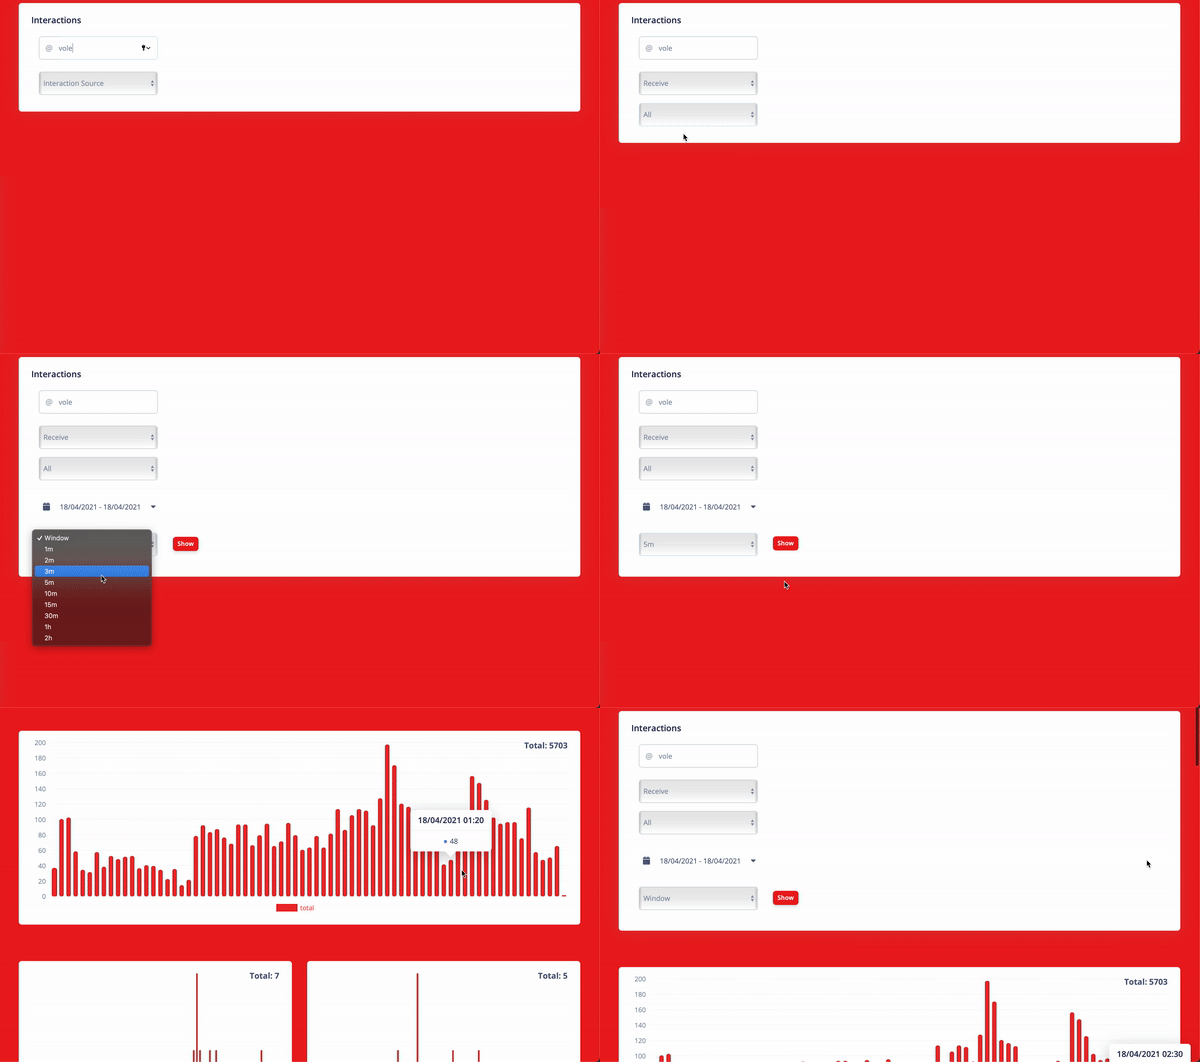
It would be the best way to convey the result of the whole system with a nice gif. Voila.
